Am.
J. Hum. Genet. 74:827–845, 2004
827
Where
West Meets East: The Complex mtDNA Landscape of the
Southwest
and Central Asian Corridor
Lluı´s
Quintana-Murci,1,2,3
Raphae¨lle Chaix,4
R. Spencer Wells,5
Doron M. Behar,6
Hamid
Sayar,12
Rosaria Scozzari,7
Chiara Rengo,9
Nadia Al-Zahery,9
Ornella Semino,9
A.
Silvana Santachiara-Benerecetti,9
Alfredo Coppa,8
Qasim Ayub,10
Aisha Mohyuddin,10
Chris
Tyler-Smith,11
S. Qasim Mehdi,10
Antonio Torroni,9
and Ken McElreavey3
1Centre
National de la Recherche Scientifique (CNRS) URA 1961, 2Unit
of Molecular Prevention and Therapy of Human Diseases, and 3Unit
of Reproduction, Fertility and Populations, Institut Pasteur, and
4Muse´e
de l’Homme, Paris; 5Wellcome
Trust Center for Human Genetics, Headington, United Kingdom; 6Bruce
Rappaport Faculty of Medicine and Research Institute, Technion and
Rambam Medical Center, Haifa, Israel; 7Dipartimento
di Genetica e Biologia Molecolare and 8Dipartimento
di Biologia Animale e dell’Uomo, Universita` “La Sapienza,”
Rome; 9Dipartimento
di Genetica e Microbiologia, Universita` di Pavia, Pavia, Italy;
10Biomedical
& Genetic Engineering Division, Dr. A. Q. Khan Research
Laboratories, Islamabad, Pakistan; 11The
Wellcome Trust Sanger Institute, Wellcome Trust Genome Campus,
Hinxton, United Kingdom; and 12Department
of Medicine, University of Arizona, Tucson
The
southwestern and Central Asian corridor has played a pivotal role in
the history of humankind, witnessing numerous waves of migration of
different peoples at different times. To evaluate the effects of
these population movements on the current genetic landscape of the
Iranian plateau, the Indus Valley, and Central Asia, we have analyzed
910 mitochondrial DNAs (mtDNAs) from 23 populations of the region.
This study has allowed a refinement of the phylogenetic relationships
of some lineages and the identification of new haplogroups in the
southwestern and Central Asian mtDNA tree. Both lineage geographical
distribution and spatial analysis of molecular
variance
showed that populations located west of the Indus Valley mainly
harbor mtDNAs of western Eurasian origin, whereas those inhabiting
the Indo-Gangetic region and Central Asia present substantial
proportions of lineages that can be allocated to three different
genetic components of western Eurasian, eastern Eurasian, and
south
Asian origin. In addition to the overall composite picture of lineage
clusters of different origin, we observed a number of deep-rooting
lineages, whose relative clustering and coalescent ages suggest an
autochthonous origin in the southwestern Asian corridor during the
Pleistocene. The comparison with Y-chromosome data revealed a highly
complex genetic and demographic history of the region, which includes
sexually asymmetrical mating patterns, founder effects, and
female-specific traces of the East African slave trade.
Introduction
The
southwestern Asian corridor is a wide geographical area that extends
from Anatolia and the trans-Caucasus area through the Iranian plateau
to the Indo-Gangetic plains of Pakistan and northwestern India. This
region is characterized by a patchwork of different
physicalanthropology types with complex boundaries and gradients and
by the coexistence of several language families(e.g., Indo-European,
Turkic, and Sino-Tibetan) as wellas relict linguistic outliers. The
southwestern Asian corridor,located at the crossroads of major
population expansions, was the first portion of Eurasia to be
inhabited by the Homo sapiens
sapiens population(s) that left Africa ∼60,000
years before the present (YBP) (Tishkoff et al. 1996; Watson et al.
1997; Quintana-Murci et al. 1999), and from this region modern humans
migrated to the rest of the world. Although Paleolithic and
Mesolithic people left their mark in the area, major prehistorical
and historical events with possible genetic consequences occurred
during the Neolithic period and later. Important agricultural
developments occurred in the eastern horn of the Fertile Crescent
∼8,000 YBP, notably in Elam
(southwestern Iran). The highly urban Elamite civilization had close
contacts with Mesopotamians but
exhibited
an extensive differentiation from the rest of the Fertile Crescent
populations, including a language
that
is thought to belong to the Dravidian family. It is hypothesized that
the proto-Elamo-Dravidian language
(McAlpin
1974, 1981), spoken by the Elamites in southwestern Iran, spread
eastwards with the movement of
farmers
from this region to the Indus Valley and the Indian subcontinent
(Cavalli-Sforza et al. 1994; Cavalli-
Sforza
1996; Renfrew 1996). Starting ∼5,000
YBP, animal domestication, particularly the horse, gave the
inhabitants of the Central Asian steppes the opportunity.
Received
December 3, 2003; accepted for publication January 20, 2004;
electronically published April 7, 2004. Address for correspondence
and reprints: Dr. Lluı´s Quintana-Murci, CNRS URA 1961, Institut
Pasteur, 25, rue Dr. Roux 75724 Paris
Cedex
15, France. E-mail: quintana@pasteur.fr
2004
by The American Society of Human Genetics. All rights reserved.
0002-9297/2004/7405-0006$15.00
828
Am. J. Hum. Genet.
74:827–845, 2004
to
expand geographically in different directions (Zvelebil 1980). These
Central Asian nomads, probably from the Andronovo and Srubnaya
cultures, migrated through Iran and Afghanistan, reaching Pakistan
and India, and their arrival is contemporaneous with the decline of
the strong agricultural South Asian civilizations, such as the
Harappans. Most likely, their arrival on the Iranian plateau ∼4,000
YBP brought the Indo-Iranian branch of the Indo-European language
family and, eventually, caused the replacement of Dravidian languages
in Iran, Pakistan, and most of northern and central India (Renfrew
1987, 1996; Cavalli-Sforza 1996). Starting in the 3rd century B.C.,
the eastern part of the Eurasian steppes witnessed similar pastoral
movements. By the time of the 3rd century A.D.,
Turkic-speaking peoples from the Altai region began to migrate
westwards, replacing Indo- European languages in parts of Central
Asia and, eventually,
in
what is now modern Turkey. Later, the Mongols also moved westward
and, by the 13th century A.D.,
established
their rule over a vast region, including parts of India, Pakistan,
and Iran and reaching as far west as the Caucasus and Turkey
(Cavalli-Sforza et al. 1994).
In
the past decade, studies of mtDNA variation have provided a
substantial contribution to the understanding of human origins and
diffusion patterns. Mt DNA surveys in worldwide populations have
shown a continent- specific distribution of mtDNA lineages (Wallace
et al. 1999; Ingman et al. 2000; Maca-Meyer et al. 2001; Herrnstadt
et al. 2002; Mishmar et al. 2003). African populations are
characterized by the oldest superhaplogroups, L1, L2, and L3 (Bandelt
et al. 1995, 2001; Chen et al. 1995, 2000; Graven et al. 1995;
Soodyall et al. 1996; Bandelt and Forster 1997; Watson et al. 1997;
Alves-Silva et al. 2000; Torroni et al. 2001b;
Salas et al. 2002), but it seems that only L3 radiated out of Africa,
mainly in the form of haplogroups M and N, ∼60,000
YBP, giving rise to the extant Eurasian variation (Watson et al.
1997; Quintana-Murci et al. 1999; Wallace et al. 1999). Most western
Eurasians are characterized by clades within haplogroup N (Torroni et
al. 1996; Macaulay et al. 1999; Richards et al. 2000), whereas N and
M contributed almost equally to the current eastern Eurasian mtDNA
pool (Stoneking et al. 1990; Ballinger et al. 1992; Torroni et al.
1993; Horai et al. 1996; Kolman et al. 1996; Comas et al. 1998;
Starikovskaya et al. 1998; Redd and Stoneking 1999; Schurr et al.
1999; Derbeneva et al. 2002; Kivisild et al. 2002; Yao et al. 2002).
Despite
the major role played by the transect between
the
Near East and India in human origin and population dispersals, the
extent and nature of mtDNA variation
in
the populations of the area are still not well resolved. In this
context, mtDNA studies have focused on the
western
and eastern extremities of the southwestern Asian corridor, including
the Near East/Caucasus region (Macaulay et al. 1999; Comas et al.
2000; Richards et al. 2000; Tambets et al. 2000; Nasidze and
Stoneking 2001) and India (Mountain et al. 1995; Kivisild et al.
1999a, 1999b;
Bamshad et al. 2001; Roychoudhury et al. 2001; Kivisild et al. 2003).
In addition, Central Asian mtDNA variation is poorly characterized
and is based only on HVS-I sequence data (Comas et al. 1998). Some
populations of the region have been also analyzed for Y-chromosome
variation, including Iranian (Quintana- Murci et al. 2001), Pakistani
(Qamar et al. 2002), and, especially, Central Asian populations
(Pe´rez-Lezaun et
al.
1999; Karafet et al. 2001; Wells et al. 2001; Zerjal et al. 2002). To
obtain a global mtDNA perspective of
the
entire region, we have now analyzed 910 mtDNAs from 23 different
populations, located mainly in the
southwestern
Asian corridor but also, for comparison, in Central Asia. As a first
step in the study,we performed high-resolution RFLP analysis and
control-region sequencing of 208 mtDNAs, 108 from the western part of
the corridor (Anatolia and the Caucasus), and 100 mtDNAs from its
southeastern counterpart (southeast Pakistan). This allowed a
clear-cut definition of the haplogroups (and their diagnostic
markers) existing in the area. The phylogenetic information retrieved
from this initial data set, together with previously published RFLP
and HVS-I data, was then used to classify an extended collection of
702 newly obtained HVS-I sequences from the Iranian plateau, the
Indus Valley, and Central Asia. The observed patterns of variation
revealed different genetic contributions from western and eastern
Eurasians and South Asians and evince complex demographic processes
in some specific populations, including sexually asymmetrical mating
patterns, founder effects, and differential migration patterns.
Material
and Methods
Population
Samples
The
approximate location of the 23 populations from which the 910 mtDNAs
were sampled is shown in figure Each sample comprises unrelated
healthy donors from whom appropriate informed consent was obtained.
For the preliminary part of the study, 208 individuals from three
different geographic regions were analyzed: 58 individuals from the
Caucasus, 50 from Turkey and 100 from southeastern Pakistan. The
three samples were heterogeneous; the sample from the Caucasus region
was made up of three different ethnic groups: Georgians, Balkarians,
and Chechens. The sample from Turkey was collected mainly in Konya
(Anatolia). The Pakistani sample was collected in Karachi and
comprised mainly Sindhis, who are a mix of tribes of different
religions and ethnicities from the southeastern province of Sindh.
The extended population sample included 702 individ
Quintana-
Murci et al.: Southwest Asian mtDNA Phylogeography 829
Figure
1 Map
of the southwestern and Central Asian corridor, showing the samples
analyzed in the present study. Population codes are as reported in
table 1. Boxed populations are those used for the initial step of the
study (see the “Materials And Methods” section). Pie charts show
the distribution of the main mtDNA lineage groups in the populations
studied. Colored sections reflect the frequency of different
haplogroup clusters, which group the western Eurasian (HV, pre-HV,
N1, J-T, U-K, I, W, and X), the South Asian (M*, U2a-c, U9, R*,
R1-R2, R5-R6, N1d, and HV2), the eastern Eurasian (M-CDGZ, A, B, F,
and N9a) and the sub-Saharan African (L1, L2, and L3A)
uals
from 20 different populations living in the Iranian plateau, the
Indus Valley, the Karakorum and Hindu Kush mountains, and Central
Asia. Further details of the whole sample collection are reported in
table 1 and in the work of Wells et al. (2001) and Qamar et al.
(2002). The term “Makrani” refers to the so-called “Negroid
Makrani”
population living in the Makran coast of Baluchistan, distinct from
the Makrani Baluch population,
which
is not considered in this study.
mtDNA
Analysis
High-resolution RFLP
haplotypes were determined for the samples from the Caucasus region,
Anatolia and Karachi. The entire mtDNA of each subject was PCR
amplified using primer pairs and procedures previously described
(Torroni et al. 1997). Each of the PCR segments was then digested
with 14 restriction endonucleases (AluI,
AvaII, BamHI,
DdeI, HaeII,
HaeIII, HhaI,
HincII, HinfI,
HpaI, MspI,
MboI, RsaI,
and TaqI). In
addition, all mtDNAs were screened for the NlaIII
sites at nucleotide positions (nps) 4216 and 4577. The presence/
absence of the BstOI/BstNI
site at np 13704, the AccI
sites at nps 14465 and 15254, the BfaI
site at np 4914, the XbaI site
at np 7440, the MseI sites
at nps 14766 and 16297, the MnlI
site at np 10871, the MboII
site at np 12703, and the HphI
site at np 10237 were also analyzed in all the Pakistani-Karachi
mtDNAs but only hierarchically in the mtDNAs from the Caucasus and
Anatolia. Polymorphisms at nps 12308 and 11719 were also tested, the
first by use of a mismatched primer that generates a HinfI
site when the transition at 12308 is present (Torroni et al. 1996)
and the second by use of a mismatched primer that generates a HaeIII
site when the transition at 11719 is present (Saillard et al. 2000).
The sequencing of the mtDNA control-region in the 208
individuals
from the Caucasus region, Anatolia, and Karachi was performed as
described elsewhere (Torroni et al. 2001a)
and, in most cases, encompassed a large region (generally from np
16000 to nps 100–200). For the remaining 702 individuals, sequence
data encompassed a shorter region (from np 16000 to np 16401), which
includes the entire HVS-I, and variable positions were determined
between nps 16024–16383, relative to the reference sequence
(Anderson et al. 1981; Andrews et al. 1999). The published RFLP data
(Macaulay et al. 1999; Quintana-Murci et al. 1999; Richards et al.
2000) and the new data obtained from the high resolution RFLP
analyses of the 208 mtDNAs (see appendix A [online only]) were used
to identify the RFLP and HVSI sites (fig. 2), which are diagnostic of
the main haplo830
Am.
J. Hum. Genet. 74:827–845, 2004
Table
1
Description
of the Populations Included in the Study
a
These
samples consist of mixed groups (see the “Materials and Methods”
section for a detailed description)
that
were used in the initial step of the study.
groups
and subhaplogroups within the mtDNA phylogeny. These markers were
then selectively assayed, on the basis of the HVS-I information, in
the remaining 702 mtDNAs by PCR amplification of the appropriate
fragment and digestion with the informative restriction enzyme.
Data
Analysis
Descriptive statistical indexes,
the Tajima’s D (Tajima
1989) and Fu’s FS
(Fu 1997) neutrality tests, and the analysis of
molecular variance (AMOVA) (Excoffier et al. 1992) were calculated
using the Arlequin software, version 2.001 (Schneider et al. 2000).
For the AMOVA analysis, we used the number of pairwise differences
for the HVS-I sequence data and haplogroup frequencies for haplogroup
data. We performed the AMOVA analyses either with all populations in
a single group or divided into several groups, according to their
geographic location or linguistic affiliation. For the geographic
grouping, we divided populations into four regions: the Anatolian/
Caucasus
region (Anatolians and Caucasus populations), the Iranian plateau
(Persians, Iranian Turks, Lurs, Iranian Kurds, Mazandarans, and
Gilaks), the Indus Valley (Baluchi, Brahui, Parsi, Sindhi,
Pakistani-Karachi,
Pathans,
Makrani, Hazara, and Gujarat) and Central Asia (Uzbeks, Turkmen,
Kurds from Turkmenistan,
Shugnan,
Hunza Burusho, and Kalash). For the linguistic division, we grouped
populations according to their linguistic affiliation: Indo-Europeans
(Persians, Lurs, Iranian Kurds, Mazandarans, Gilaks, Baluchi, Parsi,
Sindhi, Pakistani-Karachi, Pathans, Makrani, Hazara, Shugnan,Kalash,
and Gujarat), Altaic (Anatolian, Iranian Turks, Turkmen, and Uzbek),
Dravidian (Brahui), Caucasian (Caucasus), and language isolates
(Burusho). The population genetic structure was also explored through
the spatial analysis of molecular variance (SAMOVA) approach
(Dupanloup et al. 2002), which defines groups of populations that are
geographically homogeneous and maximally differentiated from each
other. This method is based on a simulated annealing procedure that
aims at maximizing the proportion of total genetic variance due to
differences between groups of populations without any a priori
definition of groups of populations that is based on geographic or
linguistic features. The SAMOVA analyses were based on HVS-I sequence
data and were done using the SAMOVA 1.0 software. Median-joining
networks (Bandelt et al. 1995, 1999)
were
constructed by hand and confirmed by the Network program (A. Ro¨ hl;
Shareware Phylogenetic Network Software Web site). For network
construction of some specific lineages, sequence data from other
populations were taken from the literature. From the Anatolia/
Caucasus region, we included Armenians (AM), Azerbaijanis (AZ), Turks
(TR), and Kurds (KR) from Richards et al. (2000); Turks (TC) from
Calafell et al. (1996); Turks (TT) from Tambets et al. (2000); and
Quintana-Murci
et al.: Southwest Asian mtDNA Phylogeography 831
Figure
2 Schematic
phylogenetic tree of mtDNA haplogroups observed in the populations
analyzed. The diagnostic mutations used to classify the whole data
set are reported on the branches. Restriction enzyme sites are
numbered from the first nucleotide of the recognition sequence. A
plus sign () indicates the presence of a restriction site; a minus
sign () indicates the absence of such a site. The restriction enzymes
are designated by the following single-letter codes: a, AluI;
b, AvaII;
c, DdeI;
e, HaeIII;
f, HhaI;
g, HinfI;
h, HpaI;
i, MspI;
j, MboI;
k, RsaI;
l, TaqI;
m, BamHI;
n, HaeII;
o, HincII;
p, BstOI;
q, NlaIII;
r, BfaI;
s, AccI;
t, MboII;
u, MseI;
v, HphI;
z, MnlI.
Mutations in the HVSI region are transitions unless the base change
is specified explicitly. Boxes indicate novel information.
Kurds
(KC) from Comas et al. (2000). From the Middle East/Arabian
Peninsula, we included Iraqis (IQ), Syrians (SY), Yemenites (YM),
Palestinians (PL), and Druze (DZ) from Richards et al. (2000);
individuals from Dubai (DB) from A.T. (unpublished data); and
Egyptians (EG) from Krings et al. (1999). From Pakistan/India, we
included Pakistanis (PK) and Indians from Andhra Pradesh (AP),
Gujarat (GK), Haryana (HY), Kashmir (KS), Maharashtra (MH), Punjab
(PN), Rajasthan (RJ), UttarPradesh (UP), and Tamil Nadu (TN) from
Kivisild et al. (1999a);
and Indians (IN) from Mountain et al. (1995). From Central Asia, we
included Kirghiz (KG), Uighur (UG), and Kazakh (KZ) samples from
Comas et al. (1998). From western Eurasia, we included Basques (BS),
Sicilians (SC), Bulgarians (BL), and Italians from Tuscany (TS) from
Richards et al. (2000); Russians (RS) from Malyarchuk et al. (2002);
Mansi (MN) from Derbeneva et al. (2002); and Sardinians (SD) from Di
Rienzo andWilson (1991).We also included Chinese (CH) from Yao et al.
(2002). The time to the most recent common ancestor of some clades
and their SEs were calculated
by
means of the estimator r,
the averaged distance to a specified founder haplotype, and were
determined as described by Forster et al. (1996) and Saillard et al.
(2000). Time estimates were also calculated, using the Network
program. Principal-components (PC) analyses were performed using SPSS
version 10.0.7 software, with basal mtDNA haplogroup frequencies as
input vectors. Admixture proportions (mY) and their SEs were
calculated, using information from all haplogroups, by means of the
program Admix 2.0 (Dupanloup and Bertorelle 2001), on the basis of
1,000 bootstraps. The parental populations used for the analysis were
Iranian populations and Gujarati for the Parsi population, and
Pakistani populations (excluding the Makrani) and a geographically
dispersed set of sub-Saharan African samples (Krings et al. 1999;
Brakez et al. 2001; Brehm et al. 2002, Salas et al. 2002) for the
Makrani population.
832
Am. J. Hum. Genet.
74:827–845, 2004
Results
The
Topology of the Southwest and Central Asian mtDNA Tree
The
complete high-resolution RFLP haplotypes and HVS-I sequence data of
the 208 individuals from the
Caucasus
region, Anatolia, and southeastern Pakistan and the detailed
haplogroup classification and HVS-I
sequence
data of the extended database of 702 individuals are reported in the
online-only material.
The
phylogenetic relationships of the 51 different named haplogroups
observed in the 910 samples, along
with
the diagnostic sites used for the mtDNA haplogroup classification,
are shown in figure 2. The vast majority of the mtDNAs clustered into
macrohaplogroups M, N, and R, but a limited number were found to
belong to the sub-Saharan haplogroups L1a, L2a, L3b, and L3d. Five
haplogroups, N1d, HV2, U9, R5, and R6, are defined here for the first
time, whereas others (U2a, U2b, and U2c) represent newly identified
subclades. Moreover, for some previously known haplogroups (R2 and
U8b), we detected diagnostic coding-region markers that allow a
better definition of the haplogroup topology within the tree.
Macrohaplogroup
N in southwestern and Central Asia is partitioned into several
branches: N1 (which also
encompasses
haplogroup I), N9a, A, W, X, and R. Within the N trunk, the new
haplogroup N1d stems
from
the node of N1 and is defined by three characteristic RFLP sites
(951MboI,
5003DdeI,
8616MboI)
and
two HVS-I transitions (nps 16301 and 16356). The internal topology of
superhaplogroup R has also been
improved.
The novel lineage R5 is defined by
8592MboI
and transitions at nps 16266 and 16304, whereas the new other
haplogroup, R6, is characterized by 12282AluI
and transitions at nps 16129 and 16362. Moreover, the R2 mtDNAs,
previously recognizable only by the HVS-I transition at np 16071, are
now identifiable through the diagnostic coding-region motif
4216NlaIII,
4769AluI,
14304AluI.
It is worth noting that 4216NlaIII
is also one defining mutation of the lineage-cluster J-T (fig. 2).
However, the comparison of entire mtDNA sequences belonging to both
R2 and J-T (A.T., unpublished data) indicates that 4216NlaIII
has indeed occurred independently on the two branches of the
phylogeny. An improvement of the classification within HV was also
obtained. A haplogroup, named HV2, was found to bear the HVS-I
transition at np 16217 and most likely is also characterized by
9336RsaI,
since 16 of the 20 mtDNAs with the
HVS-I
16217 mutation harbor this coding region site. This lineage
corresponds to an internal node of HV that
Tambets
et al. (2000) tentatively identified as P*. The improvement of the
haplogroup U subclassification was even more extensive. This major
western Eurasian haplogroup is also found in the Middle East and
India and, at lower frequencies, in northern and eastern Africa, but
the frequency distributions of its subclades appear to differ
considerably among geographical regions (Kivisild et al. 1999a,
2003; Macaulay et al. 1999; Richards et al. 2000).
Subclade U2 (characterized by the rather variable HVS-I transition at
np 16051) was previously subdivided into two branches, the “European”
U2e characterized by a further HVS-I transversion at np 16129, and
the “Indian” U2i lacking such a transversion (Kivisild et al.
1999a). We show that
U2e also harbors the distinguishing RFLP motif 13730HinfI,
15907RsaI,
and U2i is indeed made up of three clusters, here termed “U2a,”
“U2b,” and “U2c.” U2a is characterized by the rare and stable
HVS-I transversion 16206C, U2b is defined by the diagnostic site
15047HaeIII,
and U2c harbors the RFLP motif 5789TaqI,
8020MboI/
8022TaqI,
15060MboI
(fig. 2). A subset of U that was already known but is now better
defined is U8b. Finnila¨ et al. (2001) observed that, on the basis
of the shared transition at np 9698, haplogroup U8 formed a sister
clade with haplogroup K. Our data reveal that at least a subset of
U8, here termed “U8b,” is also characterized by 9052HaeII,
which is indeed also the diagnostic marker of haplogroup K. This
observation strengthens the sister haplogroup status of U8b and K.
Finally, our data reveal the presence of a new—and rare—previously
undefined subgroup of U, termed “U9,” that is characterized by
6383HaeIII.
This haplogroup does not correspond to the U9 of Herrnstadt et al.
(2002), which, in reality, corresponds to a subset of the previously
defined U3.
The
comparison of the RFLP and HVS-I data obtained from our data set
identified some pitfalls when classifying the internal lineages
within some haplogroups (e.g., J and M) on the basis of the HVS-I
sequence data alone. Thus, we classified all our J mtDNAs according
only to their differential RFLP status (fig. 2), and, since an
accurate RFLP classification of the South Asian branches of
haplogroup M remains to be defined, we adopted a conservative
classification and merged all South Asian M mtDNAs into M*.
Haplogroup
Profile Distribution
The haplogroup repertoire
present in the study populations is shaped mainly by the presence of
lineages that can be attributed toeastern Eurasia, South Asia, and
western Eurasia (fig. 1; table 2). Sub-Saharan African lineages,
represented by haplogroups L1, L2, and L3A and their internal
derivatives, are virtually absent
from
all populations analyzed except the Makrani from southern Pakistan,
among whom they reach high frequencies (39%).
Quintana-Murci
et al.: Southwest Asian mtDNA Phylogeography 833
Table
2
mtDNA
Haplogroup and Subcluster Frequencies for the 23 Study Populations
_________________________________________________________________________________________
The
eastern Eurasian component is represented by haplogroups A, B, F, and
N9a, all of which belong to
the
major N trunk, and the East Asian branches of macrohaplogroup M, such
as the C, D, G, and Z haplogroups. The latter lineages are
particularly widespread among northern and East Asians and, to a
lesser extent, Central Asians (Torroni et al. 1993, 1994a,
1994b; Kivisild et
al. 2002; Yao et al. 2002; Kong et al. 2003). The eastern Eurasian
lineage cluster shows, with some exceptions, a decreasing gradient of
frequencies towards the west (fig. 1; table 2). The highest
frequencies of these branches were found among the Central Asian
populations, reaching their maximum in the Turkmen and Uzbeks (37%
and 31%, respectively). Interestingly, Kurds from Turkmenistan showed
the lowest frequencies of eastern Eurasian lineages (9%) in Central
Asia, in
834
Am.
J. Hum. Genet. 74:827–845, 2004
sharp
contrast to the local Turkmen population. These eastern
Eurasian–specific lineages were absent—or at very low
frequencies—in populations from the Anatolian/ Caucasus region, the
Iranian plateau, and the Indus Valley, with one exception: the
Hazaras from northern Pakistan, among whom they reach 35%.
The
South Asian influence is mainly represented by the nodal type of
macrohaplogroup M (M*) and the three sister clades U2a, U2b, and U2c.
The M* haplogroup is absent or infrequent in all the populations west
of the Indus Valley and is present at low frequencies in our Central
Asian populations (!12%).
Conversely, it is present at high frequencies (30%–55%) in
populations living in the southern coasts of Pakistan and
northwestern India. The three sister clades U2a, U2b, and U2c show a
similar geographic pattern to that of haplogroup M*, although their
distribution is somewhat more restricted to the Indo-Pakistani
region. Also, N1d and HV2 and some lineages within paragroup R* are
at higher frequencies in populations located east of the Iranian
plateau, and this will be discussed in more detail below.
The
proportion of western Eurasian lineages (HV, pre- HV, N1, J-T, U-K,
I, W, and X) showed the opposite pattern of that exhibited by eastern
Eurasian lineages (fig. 1; table 2). They exhibit their highest
frequencies in the Anatolian/Caucasus and Iranian regions and their
prevalence decreases eastwards. Despite this decreasing frequency
cline towards the East, they are still present at relatively high
frequencies in the Indus Valley and Central Asia. Indeed, the western
Eurasian presence in the Kalash population reaches a frequency of
100%, the most prevalent haplogroups being U4, (pre-HV)1, U2e, and
J2.
Phylogeography
of Specific Haplogroups
The
phylogeography of several haplogroups suggests that they are either
autochthonous to the southwestern Asian corridor or that at least
they underwent a major expansion in this region. Among these
lineages, haplogroup U7 presents the most widespread distribution. U7
is virtually absent in western and eastern European populations and
is present at low frequencies (2%–4%) in the Near East, the
Caucasus region, Central Asia, and the Indian subcontinent (Kivisild
et al. 1999A, 2003;
Macaulay et al. 1999; Richards et al. 2000; Tambets et al. 2000;
Malyarchuk and Derenko 2001; Malyarchuk et al. 2002). Our data show
that this haplogroup is present in most of the populations linking
the Near East with Central and South Asia, reaching its highest
frequencies in some Iranian and Indus Valley populations (table 2),
in agreement with recent data reporting a frequency of 9% in a
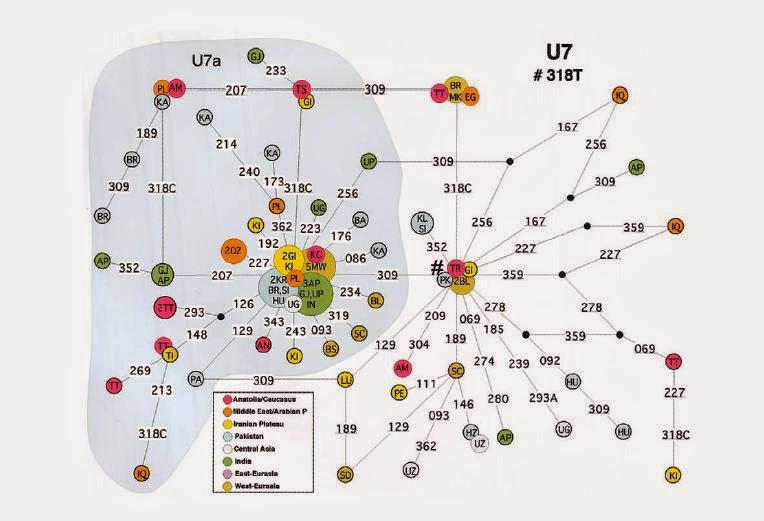
composite Iranian sample (Kivisild et al. 2003). Figure 3 shows the
median-joining network for this haplogroup. The topology of the
network shows that this haplogroup is divided into two major
welldefined star-like subclades separated by a transition at np
16309. The time-depth calculated for paragroup U7* (without 16309) is
35,100 8,500 years, whereas that for U7a (with 16309) is 22,500 5,400
years. These coalescence times support the idea that the 16318T
mutation is indeed the ancestral feature of U7. The overall
coalescence time calculated for U7 is 38,200 13,900 years.
The
phylogeography of haplogroups HV2 and R2 resembles that of U7 but has
a more restricted geographic distribution. Both haplogroups are
concentrated in southern Pakistan and India, with some overflow into
adjacent areas, including the Near East/Caucasus region, the Iranian
plateau, the Arabian Peninsula, and Central Asia, where most of the
derived types are observed (fig. 4a
and 4b).
The coalescence times were estimated at 27,7009600
years for HV2 and 31,2008200 years for R2.
The
distribution of the three sister clades within haplogroup U2 (U2a,
U2b, and U2c) is essentially restricted to the Indo-Pakistani regions
(fig. 5a–c). They
have not been observed in Europe and the Near East and, according to
our data, they are absent in the Iranian plateau and Central Asian
populations. They are, however, common in populations from Pakistan
and India. The estimated coalescence times for these haplogroups are:
45,700 14,400 years for U2a, 35,900 9000 years for U2b, and 45,200
10,400 years for U2c. The R5 lineage showed a similar distribution to
the U2 subclades (fig. 5d),
but its root types are more concentrated in the Indus Valley region,
with the derivatives in central and southern India. The estimated
time depth of this lineage is 51,800 13,800 years.
Finally,
three small haplogroups (R6, N1d, and U9) have been observed so far
only in south Pakistan. R6 was found in three individuals from the
mixed sample from Karachi; N1d in one Baluchi, one Brahui, one
Makrani, and three individuals from Karachi; and U9 in three Makrani,
one Pathan, and one individual from Karachi.
Population
Diversity and Demographic Regimes
HVS-I sequences have also been used to gain information
on the internal population diversity (table 3). Most populations
showed similar sequence diversity values, with the Kalash showing the
lowest (0.830) and the Indian Gujarati the highest (0.998). The low
diversity exhibited by the Kalash population is also evident in the
low mean number of pairwise differences (3.857). This is the lowest
value of all the populations studied, which otherwise ranged from
4.399 in the Baluchi and the Caucasus
populations
to 6.633 in the Makrani. As shown in table 3, most populations
yielded significantly nega
Quintana-Murci
et al.: Southwest Asian mtDNA Phylogeography
835
Figure
3 Network
of the U7 lineage. Circle areas are proportional to haplotype
frequency. Population codes are as reported in table 1 and in the
“Materials And Methods” section. Mutated sites (16,000) are
indicated along the branches. The number sign (#) indicates the
assumed root.
tive
values for both Tajima’s D and
Fu’s FS
neutrality tests. The only
exceptions were the Mazandarians, the
Kurds
from Turkmenistan, and the Kalash. The former two groups exhibited
significantly negative Fu’s FS
values and unimodal mismatch distributions (not
shown) but the Tajima’s D
statistic was not significantly different from 0. This
contrasting pattern may be the result of mutation rate heterogeneity
along the HVS-I region; this effect has been shown to confound the
signature of population expansion in Tajima’s test, leading to
higher D values
(Aris-Brosou and Excoffier 1996). For the Kalash population, both
neutrality tests gave nonsignificantly negative values (table 3), and
the mismatch distribution was unequivocally multimodal (data not
shown).
Population
Relationships
The
basal mtDNA haplogroup frequencies of the 23 populations were used as
input vectors to perform a PC
analysis.
Figure 6 shows the PC plot for the first two principal components,
which account for 43% and 12%
of
the total variation respectively. Leaving aside the two outliers, the
Kalash and the Makrani, geographic grouping of populations are
apparent in the diagram. The first PC (PC1) mainly reveals a
west-to-east cline by separating a group of closely related
populations from the Iranian plateau from those inhabiting the Indus
Valley and northwest India. The Central Asian Uzbeks, Turkmen, and
Shugnan tend to be closer to populations from the
Anatolian/Caucasus/Iranian regions, rather than to Indus Valley
populations, as a consequence of the high prevalence of western
Eurasian lineages observed in these populations. The Hazara from
Pakistan shows an intermediate position between populations from the
Indus Valley and those from Central Asia. PC2 essentially displays
the outlier genetic position of the Makrani and the Kalash
populations, who are separated from the rest of populations of the
Iranian plateau and the Indus
Valley.
Population
Genetic Structure: AMOVA and SAMOVA Analyses
We
investigated how the proportion of variance, based on haplogroup
(main lineages) and haplotype (HVS-I
sequences)
frequencies, was distributed in a hierarchical mode by an AMOVA
analysis (Excoffier et al. 1992). When the 23 populations were
treated as a single group, populations turned out to show overall
differentiation: the FST
value for the haplogroup data was 0.067 (P
!
.001) and the fST
for the sequence data was 0.032 (P
!
.001). The fraction of genetic variance due to
differences among linguistic groups (see the “Materials and
Methods” section) was not statistically different from 0,
836
Am. J. Hum. Genet.
74:827–845, 2004
independently
of the genetic system used (i.e., haplogroupor sequence data),
indicating that genetic variance
within
any population or among populations within
groups
was larger than that between groups and, therefore,
that
the division by linguistic affiliation is not reflected
in
mtDNA variation. Finally, when populations
were
regrouped into four geographic groups (see the
“Materials
and Methods” section), a small but significant
differentiation
among groups was detected
(F
p 0.043
and P !
.001 for haplogroup data and
CT
f
p 0.016
and P !
.001 for HVS-I data). CT
To
investigate in greater detail the genetic structure of
the
populations and the amount of genetic variation due
to
differences among population groups, we applied the
SAMOVA
algorithm (Dupanloup et al. 2002), on the
basis
of HVS-I data, searching for two, three, and four
groups.
The inclusion of the Kalash population, which
is
among the most differentiated (table 3; fig. 6), gave
inconsistent
results (data not shown), so this population
was
excluded from further analyses. A search for two
significantly
differentiated population clusters revealed
one
group consisting of all populations from the Anatolian/
Caucasus
region and the Iranian plateau (including
the
Kurds from Turkmenistan), and a second group
made
up of populations from the Indus Valley and Central
Asia
(F p 0.021;
P !
.001). In the three-group CT
search,
the previous two remained unchanged, and a
third
group, represented by the Hazara, emerged from
the
analysis (F p 0.021;
P !
.001). Finally, the search CT
for
four groups revealed the Makrani of southern Pakistan
as
the fourth most differentiated group (F p
CT
0.022;
P !
.001).
Figure
4 Networks
of (a)
HV2 and (b)
R2 lineages
Discussion
This
study provides the first comprehensive survey of mtDNA variation in a
part of the world that was among
the
first regions to be inhabited after the “out of Africa” exit, and
has subsequently experienced numerous waves of migration during the
last 50,000 years. We now discuss the events, both ancient and
modern, that are likely to have led to the current mtDNA
distribution, and compare the mtDNA data with that from other loci,
particularly the Y chromosome. The
mtDNA Landscape of the Southwestern Asia Corridor
A
simple pattern underlies the mtDNA variation in this region: a
west-to-east divide with a sharp boundary.
Populations
located west of the Indus basin, including those from Iran, Anatolia
and the Caucasus, exhibit a
common
mtDNA lineage composition, consisting mainly of western Eurasian
lineages, with a very limited
contribution
from South Asia and eastern Eurasia (fig. 1). Indeed, the different
Iranian populations show a
striking
degree of homogeneity. This is revealed not only by the
nonsignificant F values
and the PC plot (fig. 6) ST but
also by the SAMOVA results, in which a significant genetic barrier
separates populations west of Pakistan from those east and north of
the Indus Valley (results not shown). These observations suggest
either a common origin of modern Iranian populations and/or extensive
levels of gene flow amongst them. There is a virtual absence of both
common South Asian lineages (M*, U2a, U2b, and U2c) and the more
autochthonous U9, R*, R2, R5, R6, N1d, and HV2 lineages in the
Anatolian/ Caucasus region and Iranian plateau, whereas these
lineages make up 150%
of the haplogroup profile in the adjacent Indus Valley. Most of these
lineages appear to be restricted to the eastern part of the corridor
(fig. 1). Whereas geographical clustering and the coalescent age of
U7 (∼38,000 YBP; see table 2
and fig. 3)
Quintana-Murci
et al.: Southwest Asian mtDNA Phylogeography 837
Figure
5 Networks
of (a)
U2a, (b)
U2b, (c)
U2c, and (d)
R5 lineages
suggest
that it is the most widespread local lineage of Pleistocene origin
connecting the western and eastern
extremes
of the corridor, the Indus Valley and India show signals of an in
situ differentiation of deep-rooting lineages (HV2, R2, R5, U2a, U2b,
and U2c), the distribution of which appears to be limited to this
region (figs. 4 and 5). All these lineages have high time depths
(28,000– 52,000 YBP), similar to haplogroup M* (32,000– 53,000)
in the region (Kivisild et al. 1999b;
Quintana- Murci et al. 1999; Roychoudhury et al. 2001). Notably,
haplogroup M* has also not penetrated west of the Indus Valley,
although it is present at high frequencies in south Pakistani and
Indian populations. Thus, the distribution and ages of these lineages
suggest that they are the legacy of the first inhabitants of the
southwestern Asian region who underwent important expansions during
the Paleolithic period. It is interesting that the newly identified
haplogroup U9, found in the Indus Valley, has also been observed in
Ethiopia (A.T., unpublished data), supporting the link between East
Africa and the southwestern and southern coasts of Asia (Kivisild et
al. 1999a; Quintana-
Murci
et al. 1999). The absence of these lineages west of Pakistan may be
due either to limited gene flow
from
the Indus basin or to important demographic expansions in the Fertile
Crescent (including its eastern
lobe,
represented by present-day Iran), associated with a substantial
increase in frequency and diversity of western Eurasian lineages.
Geographical features such as the Dash-e Kavir and Dasht-e Lut
deserts in Iran could have acted as significant barriers to gene
flow, and this is consistent with Y-chromosomal data (e.g., the
distribution of lineage R-M17) from these regions (Quintana- Murci
et al. 2001;Wells et al. 2001; Qamar et al. 2002). Gene flow from the
Fertile Crescent to India has, how
838
Am.
J. Hum. Genet. 74:827–845, 2004
Figure
6 PC plot based on
haplogroup frequencies for the 23 population samples (population
codes are as in table 1).
ever,
been more common than that from east to west (fig.
1). Eastern populations within the corridor mostly
exhibit
a rich variety of west Eurasian lineages at high frequencies
(26%–57%), with a gradient towards the
Indian
subcontinent, with lower frequencies in caste (!10%)
and tribal groups (!1%)
(Kivisild et al. 1999A;
2003; Bamshad et al. 2001). The substantial western Eurasian presence
in the Indus Valley and northwestern
India
may have been the result of repeated gene flow received from further
west at different periods, including
the
first Paleolithic arrivals to the corridor region from the Middle
East and subsequent dispersals associated with Neolithic urban
civilizations, such as Mesopotamians and Elamites, who may have
carried farming towards the eastern part of the corridor. The
exact
mod and tempo in which the different western Eurasian lineagesreached
the Indo-Gangetic plains remains to be elucidate However, it appears
that J, T1, and U3, which have been proposed as the main marker
haplogroups fo the Neolithic diffusion of agriculture from the Middle
East to the West (Richards et al. 2000, 2002), did no play an
equivalent role in the diffusion of farming towar the East. The
eastern Eurasian contribution to the west, in contrast, is negligible
(fig. 1), in agreement wit HVS-I sequence data in Turkish populations
(Calafell e t al. 1996; Comas et al. 1996, 1998). This pattern
mayseem surprising in view of the historically documented repeated
waves of Altaic-speaking nomads (e.g., Turks, Huns, and Mongols)
starting in the 3rd century A.D.,
who traveled from east to west, imposing Altaic languages in some
western regions (e.g., Anatolia and Azer
Table
3
Diversity
Indices and Neutrality Tests for the Study Populations
a
Sequence diversity (H) and
standard error (SE).
b
Number of different
haplotypes and percentage of sample size in parentheses.
c
Number of segregating
sites.
d
Average number of pairwise
differences (Pi) with standard error (SE).
e
All P
values are !
.05 (for Tajima’s
D)
and !.02
(for Fu’s FS),
except where noted.
baijan),
probably through an elite-dominance process. In this context, it is
interesting that five of the seven
individuals
belonging to eastern Eurasian lineages west of the Indus Valley are
Turkic-speaking. The east-to-west
differences
in the genetic contribution of the eastern invaders along the
corridor may be due to the existing
population
densities in these regions at the time of arrival. The genetic
contribution of the newcomers was
strong
in the sparsely populated arid lands of eastern Central Asia.
Conversely, the eastern influence in western
territories
was much lower, since the invading eastern nomads probably found
higher population densities.
Our
results reinforce recent Y-chromosome data from Central Asia, which
show that the paternal genetic contribution
of
the eastern invaders is barely detectable west of Uzbekistan (Zerjal
et al. 2002).
The
Effects of Admixture and Drift: Demographic
Events
in Central Asia
Central
Asians exhibit high frequencies of East Asian lineages, which are
otherwise virtually absent in populations
from
the Indo-Gangetic region and westwards, concomitantly with a high
prevalence of lineages of western
Eurasian
origin (fig. 1). Two explanations have been put forward: Central
Asians could represent an early
incubator
of Eurasian variation, or their current genetic diversity could
result from later admixture between
western
and eastern Eurasian populations. Y-chromosome data have been
interpreted as indicating that Central
Asian
populations are amongst the oldest on the continent and were the
source of at least three major migration events (Wells et al. 2001)
but were also a receiver of migrations (Zerjal et al. 2002). mtDNA
studies (Comas et al. 1998) based on HVS-I variation in four
populations of Central Asia found that they contained both European
and East Asian motifs. This was interpreted as evidence for admixture
between Europeans and East Asians, a conclusion that is substantiated
by our more thorough analysis. Indeed, if Central Asia had been the
source of modern Eurasian diversity, one would expect to observe (i)
substantial overlap between present- day western and eastern Eurasian
haplogroups and
(ii)
extensive divergence between the HVS-I types found in Central Asia
and those observed in western and eastern
Eurasia.
This is not the case. Our data, which take into consideration
coding-region information and provide a more clear-cut
phylogeography, show a major demarcation in the Eurasian landscape
between European and East Asian mtDNA lineages within both the R and
N branches, and with M playing virtually no role in western Eurasia.
Moreover, most Central Asian HVSI types match sequences that are
observed today in either western or eastern Eurasians, suggesting
recent arrival in Central Asia. The complexity of the peopling of
the region is well illustrated by the Kalash population from the
Hindu Kush valleys, where western Eurasian mtDNAs reach fixation with
no detectable East or South Asian lineages (fig. 1 and table 2).
Their outlying genetic position is seen in all analyses (table 3 and
fig. 6). Moreover, although
this
population is composed of western Eurasian lineages, the most
prevalent (i.e., U4, (pre-HV)1, U2e, and J2) are rare or absent in
the surrounding populations and usually characterize populations from
Eastern Europe, the Middle East, and the Caucasus (Macaulay et al.
1999; Richards et al. 2000; Tambets et al. 2000). Also, the internal
HVS-I sequence diversity within each of these haplogroups was
surprisingly low: 12 of 15 samples belonging to U4 were associated
with the motif 16134–16356, all (pre-HV)1 samples harbored 16362,
all U2e samples were characterized by the motif 16051-
16129C-16154-16248-16362,
and all J2 mtDNAs showed the motif 16069-16126-16193-16274-16278.
These sequence motifs are almost entirely restricted to the Kalash
community, except for those associated with U4. All these
observations bear witness to the strong effects of genetic drift on
the Kalash population. This distinctive demographic scenario is
supported by the nonsignificantly negative values of Tajima’s D
and Fu’s F
neutrality tests (table 3), which reject the hypothesis S
of population growth, the unambiguous multimodal mismatch
distribution (not shown), and the small census
size
of the population, 3,000–6,000. It has been suggested that this
population descends from Greeks or from Slavic peoples, and they
claim descent from a place called Tsyam, possibly in Syria (Robertson
1896; Decker 1992). The strong effects of drift and the small
population size make genetic inference about the geographic origin of
the Kalash difficult. However, a western Eurasian origin for this
population is likely, in view of their maternal lineages, which can
ultimately be traced back to the Middle East.
Correlation
of Genes and Languages in the
Southwestern
Asian Corridor
The
study of the mtDNA pool of present-day populations living in the
southwest and Central Asian corridor shows that the linguistic
differences in these regions (i.e., mainly Indo-European vs. Altaic)
are not reflected in the patterns of mtDNA diversity. However, there
are two linguistic outliers that merit further consideration: the
Hunza Burusho and the Brahui. The Hunzas live mainly in the remote
Hunza Valley of northern Pakistan and speak Burushaski, a language
isolate of uncertain origin. Our analysis shows that the Hunza
mtDNAs, like the Y haplotypes (Qamar et al. 2002), are shared with
neighboring populations, particularly with southern Pakistanis (see
PC plot in fig. 6). This genetic pattern
840
Am.
J. Hum. Genet. 74:827–845, 2004
could
have been established before the linguistic differentiation took
place, or there could have been substantial gene flow with
neighboring populations. In any case, no distinctive genetic
signature accompanies the linguistic and geographic isolation of the
Hunza Burusho population, in agreement with recent data based on 182
autosomal
microsatellites
(Ayub et al. 2003).
The
second linguistic outlier is the Brahui population, located in
central Baluchistan, which represents a Dravidian-
speaking
enclave outside India. Historical records indicate that the Brahui
are descendants of Turko-Iranian tribes from west Asia (Hughes-Buller
1991). Today, Dravidian languages are essentially restricted to south
India and Sri Lanka, but the proto-Elamo-Dravidian hypothesis
(McAlpin 1974, 1981) proposes that they originated in the Iranian
province of Elam and were once spoken over a much larger area,
including Iran, Pakistan, Afghanistan, and all India. The Brahui
population is characterized by high prevalences (55%) of western
Eurasian mtDNAs and the lowest frequency in the region (21%) of
haplogroup M*, which otherwise is common (∼60%)
among Dravidian-speaking Indian populations.
As
shown in the PC1 (fig. 6), the Brahui lie in an intermediate position
between Iranian and Indus Valley populations,
far
from the Gujaratis and even farther from Dravidian-speaking Indian
groups (results not shown). These observations exclude the
possibility that the Dravidian presence in Baluchistan has resulted
from recent incursions of Dravidian speakers from India and show that
the maternal gene pool of the Brahui is similar to that of
Indo-Iranian speakers from the southwestern Asian corridor. Although
the present Brahui population could represent an ancient Indian
Dravidian-speaking population relocated to Pakistan, where they
admixed with local populations, no historical record supports this
hypothesis.
Thus, this suggests that they are the last northern survivors of a
larger Dravidian-speaking region
predating
the arrival of Indo-Iranian speakers, thus reinforcing the
proto-Elamo-Dravidian hypothesis (McAlpin 1974, 1981).
Traces
of Recent and Sexually Asymmetrical Events
The
phylogeographical cross-comparison of mtDNA and Y-chromosomal data is
very useful for tracing differential male and female histories. Some
populations studied here (Iranian, Pakistani, and Central Asian) have
been analyzed previously for Y-chromosomal variation (Quintana-Murci
et al. 2001; Qamar et al. 2002; Zerjal et al. 2002). In most cases,
mtDNA variation is in good agreement with the Y-chromosomal data,
suggesting that the patterns reflect general population processes. A
good, although surprising, example of concordance between the two
systems is the Hazara, who claim to be the direct male-line
descendants of Genghis Khan’s army. The presence and time depth of
the Y chromosomal haplogroup C* (xC3c) in the Hazara, along with its
absence from neighboring populations, has been interpreted as the
genetic legacy of Genghis Khan and his male relatives (Qamar et al.
2002; Zerjal et al. 2003). Our results indicate that the Hazara are
also characterized by very high frequencies of eastern Eurasian
mtDNAs (35%, table
2,
fig. 1), which are virtually absent from bordering populations,
suggesting that the male descendants of Genghis Khan, or other
Mongols, were accompanied by women of East Asian ancestry.
In
contrast to the parallelism between mtDNA and Ychromosomal data in
most populations, the Parsis and the Makrani both show a sharp
contrast between these loci. The Parsis live in southeastern
Pakistan, and historical records indicate an Iranian origin
(Nanavutty 1997). These followers of the prophet Zoroaster started
their migration from Iran in the 7th century A.D.,
settling in the northwestern Indian province of Gujarat around 900
A.D.
and eventually moving to Mumbai in India and Karachi in Pakistan.
Y-chromosome data show that they resemble Iranian populations rather
than their neighbors in Pakistan: an admixture estimate of 100% from
Iran was obtained (Qamar et al. 2002), supporting the historical
records. However, when the Parsi mtDNA pool was compared with those
of the Iranians and Gujaratis
(their
putative parental populations), a strong contrast with the
Y-chromosomal data emerged. About 60% of their maternal gene pool
belongs to South Asian haplogroups, which make up only 7% of the
combined Iranian sample (table 2). The very high frequency of
haplogroup M among the Parsis (55%), similar to those of Indian
populations and much higher than that of the combined Iranian sample
(1.7%), highlights their close affinities with India (fig. 6). Our
results lead to an admixture estimate of 100% from Gujarat and
provide a strong contrast between the maternal and paternal
components of this population. Although the small population size of
the Parsis (a few thousand) may have distorted
haplogroup
frequencies in this population, diversity of both Y-chromosome and
mtDNA lineages remains high, making a strong drift effect unlikely.
Our results therefore support a male-mediated migration of the
ancestors of the present-day Parsi population from Iran to India,
where they admixed with local females, or directional mating in
Gujarat between Iranian males and local women, leading ultimately to
the loss of mtDNAs of Iranian origin.
Another
example of an unequal sex-specific contribution is seen in the
so-called “Negroid” Makrani of Baluchistan. This population lives
in the Makran coastal region and shows distinct African physical
traits (Sultana 1995). We observed a high presence (39%) of lineages
L3d, L3b, L2a, and L1a, generally restricted to sub- Saharan African
populations (Chen
et
al. 1995, 2000;
Quintana-Murci
et al.: Southwest Asian mtDNA Phylogeography
841
Salas
et al. 2002) and otherwise present in only 4 of the remaining 877
individuals examined. The presence of
African
mtDNAs among the Makrani seems to be of recent origin, since the
Makrani haplotypes are identical to those observed in modern
sub-Saharan African populations (Salas et al. 2002), particularly in
Bantu-speaking populations from Mozambique. Indeed, all but one of
the Makrani L1, L2, and L3A types matched Mozambique sequences, and
these were the most frequent haplotypes in the Mozambique samples
(L1a2, L2a1a, and L2a1b) (Pereira et al. 2001; Salas et al. 2002).
Our results contrast with the Makrani Y-chromosome profile, which is
similar to that of other Pakistani populations and is dominated by
western Eurasian lineages (Qamar et al. 2002). The sub-Saharan
African male-specific contribution, represented primarily by Hg E-M2,
occurred at only 9% in the Makrani and is also present in neighboring
populations,
although at a lower prevalence (2%–4%). We estimated the maternal
and paternal contributions
of
sub-Saharan Africans to the current Makrani gene pool, using
information from all haplogroups, at 12% (7%) for the Y chromosome
and 40% (9%) for the mtDNA. These findings must be interpreted in the
light of known historical data. Forced migration from Africa began in
the 7th century and increased considerably during the Omani Empire.
The latter formed a strong slave-trade connection between the Makran
port of Gwadar, the principal ports of Oman, and ports located in
East Africa, including Mozambique (Clarence- Smith 1989; Sultana
1995). In the 16th and 17th centuries, the Portuguese also traded
between Mozambique and southwestern Asia. The African component in
the Makrani community may therefore represent the genetic legacy of
this slave trade. Whereas the Atlantic slave trade dealt mainly with
male labor, the East African slave trade seemingly favored females
over males (Lovejoy 2000). Slave women were mainly domestics and/or
concubines, and children fathered by the master were freed. In
addition, strong cultural barriers hindered male slaves from
fathering children, a situation exacerbated by the proportion of
slaves imported as eunuchs (Lovejoy 2000). As a consequence of these
practices, the contribution of paternal African genes to the
population is expected to be low. Indeed, the contrast between male
and female African contributions observed among the Makrani strongly
supports historical records of a female sex bias during the East
African slave trade. Other factors, such as asymmetrical mating
patterns between African women and autochthonous males during the
process of genetic admixture, and/or unequal reproductive success
among Makrani males, might have accelerated the loss of African Y
chromosomes from the population. In this context, a similar pattern
has been reported recently in the Yemeni Hadramawt population
(Richards et al. 2003), geographically adjacent to East Africa, where
the African maternal contribution has also been interpreted as the
result of the East African slave trade. Our data not only confirm a
female-biased slave trade towards the East but also show that this
pattern, which includes differential mating patterns between the
sexes, extended to the eastern limits of the East African slave
trade.
Conclusions
Our
analysis of mtDNAs from the southwestern and Central Asian corridor
shows that the highest variation is observed in populations located
in the Indus Valley and Central Asia, highlighting this region as the
place where western Eurasian lineages meet both the South Asian and
eastern Eurasian genetic strata, respectively. The amalgamation of
different genetic components in this area may have resulted from the
successive and continuous waves of migration from diverse
geographical sources at different time periods, from the early human
settlements in the region after the “out of Africa” dispersal to
migrations associated with the diffusion of new technologies, such as
farming and/or pastoral nomadism,
and
accompanied by new languages, like the incursions of Indo-Iranian
speakers from the northwest.
In
addition, the Indo-Gangetic region is characterized by the presence
of autochthonous genetic footprints of
Pleistocene
origin and traces of recent historical events, such as the East
African slave trade. This extraordinarily
rich
and heterogeneous genetic portrait testifies to the numerous and
complex movements in the region and evinces more subtle demographic
episodes in some populations, including founder effects and sexually
asymmetrical events associated with differential migration patterns
between males and females.
Acknowledgments
_________________________________________________________
We
warmly acknowledge Hans-Ju¨ rgen Bandelt, for stimulating remarks
and quality check of the data; Francesca Luca,
for
help in data analysis; and two anonymous reviewers, for helpful and
constructive criticisms. This work was supported
by
CNRS and a North Atlantic Treaty Organization collaborative linkage
grant (LST.CLG.977507) (to L.Q.-M.). Financial
support
was also provided by TheWellcome Trust (to C.T.- S. and S.Q.M.), the
Italian Ministry of the University (Progetti
Ricerca
Interesse Nazionale 2001, 2002, 2003) (to A.T., R.S., and A.C.),
Progetto CNR-MIUR Genomica Funzionale-Legge
449/97
(to A.T.), Fondo Investimenti Ricerca di Base 2001 (to A.T.), Fondo
d’Ateneo per la Ricerca 2002 dell’Universita` di
Pavia
(to A.T.), Progetto Finalizzato C.N.R. “Beni Culturali”( to
A.S.S.-B.), Grandi Progetti di Ateneo (to R.S.), and the
Istituto
Pasteur Fondazione Cenci Bolognetti (to R.S.). N.A.- Z. was supported
by The International Center for Genetic
Engineering
and Biology (Trieste) and University of Pavia fellowships.
842
Am. J. Hum. Genet.
74:827–845, 2004
Electronic-Database
Information
_____________________________________________
References
__________________________________________
Alves-Silva
J, da Silva Santos M, Guimaraes PE, Ferreira AC,
Bandelt
HJ, Pena SD, Prado VF (2000) The ancestry of Brazilian
mtDNA
lineages. Am J Hum Genet 67:444–461
Anderson
S, Bankier AT, Barrell BG, de Bruijn MH, Coulson
AR,
Drouin J, Eperon IC, Nierlich DP, Roe BA, Sanger F,
Schreier
PH, Smith AJ, Staden R, Young IG (1981) Sequence
and
organization of the human mitochondrial genome. Nature
290:457–465
Andrews
RM, Kubacka I, Chinnery PF, Lightowlers RN, Turnbull
DM,
Howell N (1999) Reanalysis and revision of the
Cambridge
reference sequence for human mitochondrial
DNA.
Nat Genet 23:147
Aris-Brosou
S, Excoffier L (1996) The impact of population
expansion
and mutation rate heterogeneity on DNA sequence
polymorphism.
Mol Biol Evol 13:494–504
Ayub
Q, Mansoor A, Ismail M, Khaliq S, Mohyuddin A, Hameed
A,
Mazhar K, Rehman S, Siddiqi S, Papaioannou M,
Piazza
A, Cavalli-Sforza LL, Mehdi SQ (2003) Reconstruction
of
human evolutionary tree using polymorphic autosomal
microsatellites.
Am J Phys Anthropol 122:259–268
Ballinger
SW, Schurr TG, Torroni A, Gan YY, Hodge JA, Hassan
K,
Chen KH, Wallace DC (1992) Southeast Asian mitochondrial
DNA
analysis reveals genetic continuity of ancient
mongoloid
migrations. Genetics 130:139–15
Bamshad M, Kivisild T,
Watkins WS, Dixon ME, Ricker CE,
Rao
BB, Naidu JM, Prasad BV, Reddy PG, Rasanayagam
A,
Papiha SS, Villems R, Redd AJ, Hammer MF, Nguyen
SV,
Carroll ML, Batzer MA, Jorde LB (2001) Genetic evidence
on
the origins of Indian caste populations. Genome
Res
11:994–1004
Bandelt
HJ, Forster P, Sykes BC, Richards MB (1995) Mitochondrial
portraits
of human populations using median networks.
Genetics
141:743–753
Bandelt
HJ, Forster P (1997) The myth of bumpy hunter-gatherer
mismatch
distributions. Am J Hum Genet 61:980–983
Bandelt
HJ, Forster P, Rohl A (1999) Median-joining networks
for
inferring intraspecific phylogenies. Mol Biol Evol 16:37–
48
Bandelt
HJ, Lahermo P, Richards M, Macaulay V (2001) Detecting
errors
in mtDNA data by phylogenetic analysis. Int
J
Legal Med 115:64–69
Brakez
Z, Bosch E, Izaabel H, Akhayat O, Comas D, Bertranpetit
J,
Calafell F (2001) Human mitochondrial DNA
sequence
variation in the Moroccan population of the Souss
area.
Ann Hum Biol 28:295–307
Brehm
A, Pereira L, Bandelt H-J, Prata MJ, Amorim A (2002)
Mitochondrial
portrait of the Cabo Verde archipelago: the
Senegambian
outpost of Atlantic slave trade. Ann Hum Genet
66:49–60
Calafell
F, Underhill P, Tolun A, Angelicheva D, Kalaydjieva
L
(1996) From Asia to Europe: mitochondrial DNA sequence
variability
in Bulgarians and Turks. Ann Hum Genet
60:35–49
Cavalli-Sforza
LL, Piazza A, Menozzi P (1994) The history
and
geography of human genes. Princeton University Press,
Princeton,
NJ
Cavalli-Sforza
(1996) The spread of agriculture and nomadic
pastoralism:
insights from the genetics, linguistics and archaeology.
In:
Harris DR (ed) The origins and spread of
Agriculture
and Pastoralism in Eurasia. Smithsonian Institution
Press,
Washington, DC, pp 51–69
Chen
YS, Torroni A, Excoffier L, Santachiara-Benerecetti AS,
Wallace
DC (1995) Analysis of mtDNA variation in African
populations
reveals the most ancient of all human continentspecific
haplogroups.
Am J Hum Genet 57:133–149
Chen
YS, Olckers A, Schurr TG, Kogelnik AM, Huoponen K,
Wallace
DC (2000) mtDNA variation in the South African
Kung
and Khwe-and their genetic relationships to other African
populations.
Am J Hum Genet 66:1362–1383
Clarence-Smith
WG (1989) The economics of the Indian
Ocean
slave trade in the nineteenth century. Frank Cass,
London
Comas
D, Calafell F, Mateu E, Perez-Lezaun A, Bertranpetit
J
(1996) Geographic variation in human mitochondrial
DNA
control region sequence: the population history of Turkey
and
its relationship to the European populations. Mol
Biol
Evol 13:1067–1077
Comas
D, Calafell F, Mateu E, Perez-Lezaun A, Bosch E, Martinez-
Arias
R, Clarimon J, Facchini F, Fiori G, Luiselli D,
Pettener
D, Bertranpetit J (1998) Trading genes along the
silk
road: mtDNA sequences and the origin of Central Asian
populations.
Am J Hum Genet 63:1824–1838
Comas
D, Calafell F, Bendukidze N, Fananas L, Bertranpetit
J
(2000) Georgian and Kurd mtDNA sequence analysis
shows
a lack of correlation between languages and female
genetic
lineages. Am J Phys Anthropol 112:5–16
Decker
KD (1992) Sociolinguistic survey of northern Pakistan.
Vol
5, Languages of Chitral. National Institute of Pakistan
Studies,
Islamabad
Derbeneva
OA, Starikovskaya EB, Wallace DC, Sukernik RI
(2002)
Traces of early Eurasians in the Mansi of northwest
Siberia
revealed by mitochondrial DNA analysis. Am J Hum
Genet
70:1009–14
Di
Rienzo A, Wilson AC (1991) Branching pattern in the evolutionary
tree
for human mitochondrial DNA. Proc Natl
Acad
Sci USA 88:1597–1601
Dupanloup
I, Bertorelle G (2001) Inferring admixture proportions
from
molecular data: extension to any number of
parental
populations. Mol Biol Evol 18:672–675
Dupanloup
I, Schneider S, Excoffier L (2002) A simulated annealing
approach
to define the genetic structure of populations.
Mol
Ecol 11:2571–2581
Excoffier
L, Smouse PE, Quattro JM (1992) Analysis of molecular
variance
inferred from metric distances among DNA
haplotypes:
application to human mitochondrial DNA restriction
data.
Genetics 131:479–491
Finnila¨
S, Lehtonen MS, Majamaa K (2001) Phylogenetic netQuintana-
Murci
et al.: Southwest Asian mtDNA Phylogeography 843
work
for European mtDNA. Am J Hum Genet 68:1475–
1484
Forster
P, Harding R, Torroni A, Bandelt HJ (1996) Origin
and
evolution of Native American mtDNA variation: a reappraisal.
Am
J Hum Genet 59:935–945
Fu
YX (1997) Statistical tests of neutrality of mutations against
population
growth, hitchhiking and background selection.
Genetics
147:915–925
Graven
L, Passarino G, Semino O, Boursot P, Santachiara-
Benerecetti
S, Langaney A, Excoffier L (1995) Evolutionary
correlation
between control region sequence and restriction
polymorphisms
in the mitochondrial genome of a large Senegalese
Mandenka
sample. Mol Biol Evol 12:334–345
Herrnstadt
C, Elson JL, Fahy E, Preston G, Turnbull DM,
Anderson
C, Ghosh SS, Olefsky JM, Beal MF, Davis RE,
Howell
N(2002) Reduced-median-network analysis of complete
mitochondrial
DNA coding-region sequences for the
major
African, Asian, and European haplogroups. Am J
Hum
Genet 70:1152–1171
Horai
S, Murayama K, Hayasaka K, Matsubayashi S, Hattori
Y,
Fucharoen G, Harihara S, Park KS, Omoto K, Pan IH
(1996)
mtDNA polymorphism in East Asian populations,
with
special reference to the peopling of Japan. Am J Hum
Genet
59:579–590
Hughes-Buller
R (1991) Imperial gazetteer of India: provincial
series,
Baluchistan. Sang-e-Meel, Lahore, Pakistan
Ingman
M, Kaessmann H, Pa¨a¨bo S, Gyllensten U (2000) Mitochondrial
genome
variation and the origin of modern humans.
Nature
408:708–713
Karafet
T, Xu L, Du R, Wang W, Feng S, Wells RS, Redd AJ,
Zegura
SL, Hammer MF (2001) Paternal population history
of
East Asia: sources, patterns, and microevolutionary processes.
Am
J Hum Genet 69:615–628
Kivisild
T, Bamshad MJ, Kaldma K, Metspalu M, Metspalu
E,
Reidla M, Laos S, Parik J, Watkins WS, Dixon ME, Papiha
SS,
Mastana SS, Mir MR, Ferak V, Villems R (1999a)
Deep
common ancestry of indian and western-Eurasian mitochondrial
DNA
lineages. Curr Biol 9:1331–1334
Kivisild
T, Kaldma K, Metspalu M, Parik J, Papiha SS, Cillems
R
(1999b)
The place of the Indian mitochondrial DNA variants
in
the global network of maternal lineages and the
peopling
of the Old Word. In: Deka R, Papiha SS (eds)
Genomic
Diversity. Kluwer/Academic/Plenum Publishers,
New
York, pp 135–152
Kivisild
T, Tolk HV, Parik J, Wang Y, Papiha SS, Bandelt HJ,
Villems
R (2002) The emerging limbs and twigs of the East
Asian
mtDNA tree. Mol Biol Evol 19:1737–1751
Kivisild
T, Rootsi S, Metspalu M, Mastana S, Kaldma K, Parik
J,
Metspalu E, Adojaan M, Tolk HV, Stepanov V, Golge M,
Usanga
E, Papiha SS, Cinnioglu C, King R, Cavalli-Sforza
L,
Underhill PA, Villems R (2003) The genetic heritage of
the
earliest settlers persists both in Indian tribal and caste
populations.
Am J Hum Genet 72:313–332
Kolman
CJ, Sambuughin N, Bermingham E (1996) Mitochondria
DNA
analysis of Mongolian populations and implications
for
the origin of New World founders. Genetics
142:1321–1334
Kong
QP, Yao YG, Sun C, Bandelt HJ, Zhu CL, Zhang YP
(2003)
Phylogeny of East Asian mitochondrialDNAlineages
inferred
from complete sequences. AmJ HumGenet 73:671–
676
Krings
M, Salem AE, Bauer K, Geisert H, Malek AK, Chaix
L,
Simon C, Welsby D, Di Rienzo A, Utermann G, Sajantila
A,
Paabo S, Stoneking M (1999) mtDNA analysis of Nile
River
Valley populations: A genetic corridor or a barrier to
migration?
Am J Hum Genet 64:1166–1176
Lovejoy
PE (2000) Transformations in slavery: a history of
slavery
in Africa. Cambridge University Press, Cambridge
United
Kingdom
Maca-Meyer
N, Gonzalez AM, Larruga JM, Flores C, Cabrera
VM
(2001) Major genomic mitochondrial lineages delineate
early
human expansions. BMC Genet 2:13
Macaulay
V, Richards M, Hickey E, Vega E, Cruciani F, Guida
V,
Scozzari R, Bonne-Tamir B, Sykes B, Torroni A (1999)
The
emerging tree of west Eurasian mtDNAs: a synthesis of
control-region
sequences and RFLPs. Am J Hum Genet 64:
232–249
Malyarchuk
BA, Derenko MV (2001) Mitochondrial DNA
variability
in Russians and Ukrainians: implication to the
origin
of the Eastern Slavs. Ann Hum Genet 65:63–78
Malyarchuk
BA, Grzybowski T, Derenko MV, Czarny J, Wozniak
M,
Miscicka-Sliwka D (2002) Mitochondrial DNAvariability
in
Poles and Russians. Ann Hum Genet 66:261–283
McAlpin
DW (1974) Toward Proto-Elamo-Dravidian. Language
50:89–101
McAlpin
DW (1981) Proto-Elamo-Dravidian: the evidence
and
its implications. Trans Am Phylosophical Soc 71:3–155
Mishmar
D, Ruiz-Pesini E, Golik P, Macaulay V, Clark AG,
Hosseini
S, Brandon M, Easley K, Chen E, Brown MD,
Sukernik
RI, Olckers A, Wallace DC (2003) Natural selection
shaped
regional mtDNA variation in humans. Proc Natl
Acad
Sci USA 100:171–6.
Mountain
JL, Hebert JM, Bhattacharyya S, Underhill PA, Ottolenghi
C,
Gadgil M, Cavalli-Sforza LL (1995) Demographic
history
of India and mtDNA-sequence diversity. Am
J
Hum Genet 56:979–992
Nanavutty
P (1997) The Parsis. National Book Trust, New
Delhi,
India
Nasidze
I, Stoneking M (2001) Mitochondrial DNA variation
and
language replacements in the Caucasus. Proc R Soc
Lond
B Biol Sci 268:1197–1206
Pereira
L, Macaulay V, Torroni A, Scozzari R, Prata MJ, Amorim
A
(2001) Prehistoric and historic traces in the mtDNA
of
Mozambique: insights into the Bantu expansions and the
slave
trade. Ann Hum Genet 65:439–458
Pe´rez-Lezaun
A, Calafell F, Comas D, Mateu E, Bosch E, Martinez-
Arias
R, Clarimon J, Fiori G, Luiselli D, Facchini F,
Pettener
D, Bertranpetit J (1999) Sex-specific migration patterns
in
Central Asian populations, revealed by analysis of
Y-chromosome
short tandem repeats and mtDNA. Am J
Hum
Genet 65:208–219
Qamar
R, Ayub Q, Mohyuddin A, Helgason A, Mazhar K,
Mansoor
A, Zerjal T, Tyler-Smith C, Mehdi SQ (2002) Ychromosomal
DNA
variation in Pakistan. Am J Hum Genet
70:1107–1124
Quintana-Murci
L, Semino O, Bandelt HJ, Passarino G,
McElreavey
K, Santachiara-Benerecetti AS (1999) Genetic
evidence
of an early exit of Homo sapiens sapiens from
Africa
through eastern Africa. Nat Genet 23:437–441
844
Am. J. Hum. Genet.
74:827–845, 2004
Quintana-Murci
L, Krausz C, Zerjal T, Sayar SH, Hammer
MF,
Mehdi SQ, Ayub Q, Qamar R, Mohyuddin A, Radhakrishna
U,
Jobling MA, Tyler-Smith C, McElreavey K
(2001)
Y-chromosome lineages trace diffusion of people and
languages
in southwestern Asia. Am J Hum Genet 68:537–
542
Redd
AJ, Stoneking M (1999) Peopling of Sahul: mtDNA variation
in
aboriginal Australian and Papua New Guinean
populations.
Am J Hum Genet 65:808–828
Renfrew
C (1987) Archaeology and language: the puzzle of
Indo-European
origins. Jonathan Cape, London
Renfrew
C (1996) Languages families and the spread of farming.
In:
Harris DR (ed) The origins and spread of agriculture
and
pastoralism in Eurasia. Smithsonian Institution Press,
Washington,
DC, pp 70–92
Richards
M, Macaulay V, Hickey E, Vega E, Sykes B, Guida
V,
Rengo C, et al (2000) Tracing European founder lineages
in
the Near Eastern mtDNA pool. Am J Hum Genet 67:
1251–1276
Richards
M, Macaulay V, Torroni A, Bandelt H-J (2002) In
search
of geographical patterns in European mtDNA. Am J
Hum
Genet 71:1168–1174
Richards
M, Rengo C, Cruciani F, Gratrix F, Wilson JF, Scozzari
R,
Macaulay V, Torroni A (2003) Extensive femalemediated
gene
flow from sub-Saharan Africa into near eastern
Arab
populations. Am J Hum Genet 72:1058–1064
Robertson
GS (1896) The Kafirs of the Hindu-Kush, Oxford
University
Press, Karachi, Pakistan
Roychoudhury
S, Roy S, Basu A, Banerjee R, Vishwanathan
H,
Usha Rani MV, Sil SK, Mitra M, Majumder PP (2001)
Genomic
structures and population histories of linguistically
distinct
tribal groups of India. Hum Genet 109:339–350
Saillard
J, Forster P, Lynnerup N, Bandelt HJ, Norby S (2000)
mtDNA
variation among Greenland Eskimos: the edge of
the
Beringian expansion. Am J Hum Genet 67:718–726
Salas
A, Richards M, De la Fe T, Lareu MV, Sobrino B, Sanchez-
Diz
P, Macaulay V, Carracedo A (2002) The making
of
the African mtDNA landscape. Am J Hum Genet 71:
1082–1111
Schneider
S, Roessli D, Excoffier L (2000) Arlequin ver 2.0:
a
software for population genetics data analysis. Genetics
and
Biometry Laboratory, University of Geneva, Geneva,
Switzerlan
Schurr
TG, Sukernik RI, Starikovskaya YB,WallaceDC(1999)
Mitochondrial
DNA variation in Koryaks and Itel’men:
population
replacement in the Okhotsk Sea-Bering Sea region
during
the Neolithic. Am J Phys Anthropol 108:1–39
Soodyall
H, Vigilant L, Hill AV, Stoneking M, Jenkins T (1996)
mtDNA
control-region sequence variation suggests multiple
independent
origins of an “Asian-specific” 9-bp deletion in
sub-Saharan
Africans. Am J Hum Genet 58:595–608
Starikovskaya
YB, Sukernik RI, Schurr TG, Kogelnik AM,
Wallace
DC (1998) mtDNA diversity in Chukchi and Siberian
Eskimos:
implications for the genetic history of Ancient
Beringia
and the peopling of the New World. Am J
Hum
Genet 63:1473–1491
Stoneking
M, Jorde LB, Bhatia K, Wilson AC (1990) Geographic
variation
in human mitochondrial DNA from Papua
New
Guinea. Genetics 124:717–733
Sultana
F (1995) Gwat and Gwat-i-leb: Spirit healing and social
change
in Makran. In: Titus P (ed) Marginality and
modernity:
ethnicity and change in post-colonial Balochistan.
Oxford
University Press, Karachi, pp 28–50
Tajima
F (1989) Statistical method for testing the neutral mutation
hypothesis
by DNA polymorphism. Genetics 123:
585–595
Tambets
K, Kivisild T, Metspalu E, Parik J, Kaldma K, Laos
S,
Tolk HV, Go¨ lge M, Demirtas H, Geberhiwot T, De Stefano
GP,
Papiha SS, Villems R (2000) The topology of the maternal
lineages
of the Anatolian and Trans-Caucasus populations
and
the peopling of Europe: preliminary conclusions.
In:
Renfrew C, Boyle K (eds) Archaeogenetics: DNA
and
the population prehistory of Europe. McDonald Institute
for
Archaeological Research Monograph Series, Cambridge
University,
Cambridge, United Kingdom, pp 219–235
Tishkoff
SA, Dietzsch E, SpeedW, Pakstis AJ, Kidd JR, Cheung
K,
Bonne-Tamir B, Santachiara-Benerecetti AS, Moral P,
Krings
M (1996) Global patterns of linkage disequilibrium
at
the CD4 locus and modern human origins. Science 271:
1380–1387
Torroni
A, Sukernik RI, Schurr TG, Starikorskaya YB, Cabell
MF,
Crawford MH, Comuzzie AG, Wallace DC (1993)
mtDNA
variation of aboriginal Siberians reveals distinct genetic
affinities
with Native Americans. Am J Hum Genet 53:
591–608
Torroni
A, Miller JA, Moore LG, Zamudio S, Zhuang J,
Droma
T,Wallace DC (1994a)
Mitochondrial DNA analysis
in
Tibet: implications for the origin of the Tibetan population
and
its adaptation to high altitude. Am J Phys Anthropol
93:189–199
Torroni
A, Neel JV, Barrantes R, Schurr TG, Wallace DC
(1994b)
Mitochondrial DNA “clock” for the Amerinds and
its
implications for timing their entry into North America.
Proc
Natl Acad Sci USA 91:1158–1162
Torroni
A, Huoponen K, Francalacci P, Petrozzi M, Morelli
L,
Scozzari R, Obinu D, Savontaus ML, Wallace DC (1996)
Classification
of European mtDNAs from an analysis of
three
European populations. Genetics 144:1835–1850
Torroni
A, Petrozzi M, D’Urbano L, Sellitto D, Zeviani M,
Carrara
F, Carducci C, Leuzzi V, Carelli V, Barboni P, De
Negri
A, Scozzari R (1997) Haplotype and phylogenetic
analyses
suggest that one European-specific mtDNA background
plays
a role in the expression of Leber hereditary
optic
neuropathy by increasing the penetrance of the primary
mutations
11778 and 14484. Am J Hum Genet 60:
1107–1121
Torroni
A, Bandelt HJ, Macaulay V, Richards M, Cruciani F,
Rengo
C, Martinez-Cabrera V, et al (2001a)
A signal, from
human
mtDNA, of postglacial recolonization in Europe.Am
J
Hum Genet 69:844–852
Torroni
A, Rengo C, Guida V, Cruciani F, Sellitto D, Coppa
A,
Luna Calderon F, Simionati B, Valle G, Richards M,
Macaulay
V, Scozzari R (2001b)
Do the four clades of the
mtDNA
haplogroup L2 evolve at different rates? Am J Hum
Genet
69:1348–1356
Wallace
DC, Brown MD, LottMT(1999) MitochondrialDNA
variation
in human evolution and disease. Gene 238:211–
230
Watson
E, Forster P, Richards M, Bandelt HJ (1997) MitoQuintana-
Murci
et al.: Southwest Asian mtDNA Phylogeography 845
chondrial
footprints of human expansions in Africa. Am J
Hum
Genet 61:691–704
Wells
RS, Yuldasheva N, Ruzibakiev R, Underhill PA, Evseeva
I,
Blue-Smith J, Jin L, et al (2001) The Eurasian heartland:
a
continental perspective on Y-chromosome diversity. Proc
Natl
Acad Sci USA 98:10244–10249
Yao
YG, Kong QP, Bandelt HJ, Kivisild T, Zhang YP (2002)
Phylogeographic
differentiation of mitochondrial DNA in
Han
Chinese. Am J Hum Genet 70:635–651
Zerjal
T, Wells RS, Yuldasheva N, Ruzibakiev R, Tyler-Smith
C
(2002) A genetic landscape reshaped by recent events: Ychromosomal
insights
into Central Asia. Am J Hum Genet
71:466–482
Zerjal
T, Xue Y, Bertorelle G, Wells RS, Bao W, Zhu S, Qamar
R,
Ayub Q, Mohyuddin A, Fu S, Li P, Yuldasheva N, Ruzibakiev
R,
Xu J, Shu Q, Du R, Yang H, Hurles ME, Robinson
E,
Gerelsaikhan T, Dashnyam B, Mehdi SQ, Tyler-
Smith
C (2003) The genetic legacy of the Mongols. Am J
Hum
Genet 72:717–721
Zvelebil
M (1980) The rise of the nomads in Central Asia. In:
Sherratt
A (ed) The Cambridge encyclopedia of archaeology.
Crown,
New York, pp 252–256